Confusion-Martix
Confusion Matrix
Confusion matrix ,also know as error matrix ,is a specific table layout that allows visualization of the performance of our algorithm (or model) ,typically supervised learning (in unsupervised learning it is usually called a matching matrix). Each row of the matrix contains the predicted value of our model and each column contains the actual value.
Note : Like accuracy confusion matrix also takes only predicted values , it do not take probability scores.
A model is said to be binary classifier if its output contains only two values/classes/instances like (yes/no or +1/-1 … etc). A model is said to be multi-class classifier if it gives output ranges more than 2 classes or values .
For binary classifiers the size of confusion matrix is \({2 \times 2}\) , for multi class classifier the size of confusion matrix is \({n \times n}\) where n is number of classes.
Inorder to make things simple , lets take a binary classifier which classifies if the image is dog or cat. If it is dog it returns 0 else returns 1 if it is a cat.
Remember we always find the performance of our model using testing dataset .So lets consider out test dataset have 12 images both dogs + cats.
The actual values (\({Y}\)) = [1,1,1,1,1,1,1,1,0,0,0,0]
– 1: stands for cats
– 0: stands for dogs
These images are given as input to our model ,which produces following output
Predicted values (\({\hat Y}\)) = [0,0,1,1,1,1,1,1,0,0,0,1]
We can see that our model predicted 9 images correctly and 3 images wrong. 2 cats are classifed wrongly as dogs and 1 dog is classified wrongly as cat.
With these two labels (cats(1) and dogs(0)) confusion matrix of our model looks as follow
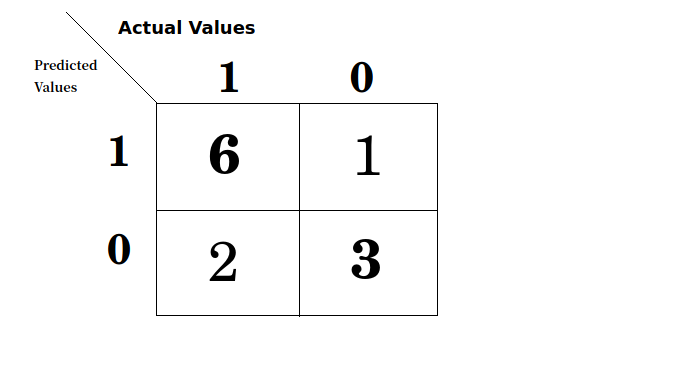
From the above confusion matrix we can clearly visualise that 9 (= 6 + 3) values are correctly predicted 2 dogs(class 1) is falsly predicted as dog(class 0) and 1 dog is wrongly predicted as cat.
Hope till here you have got some idea on confusion matrix. Now lets dive deep into confusion matrix , learn some terms related to confusion matrix that play a key role in judging our model.
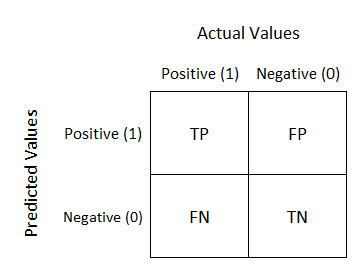
As we know a binary classifier has only two classes to classify, lets assume 1 class as positive and other as negative class. Below image shows some metrics related to confusion matrix.
-
True Positive (TP) : Number of predictions that our classifier predicted Positive class as Positive.
-
True Negative (TN): Number of predictions that our classifier predicted Negative class as Negative.
-
False Positive (FP): Number of predictions that our classifier predicted Negative class as Positive.
-
False Negative (FN): Number of predictions that our classifier predicted Negative values Positive.
- Total Number of Positive class (P) : TP + FN
- Total Number of Negative class (N) : FP + TN
Note :

Elements in the green border are said to be in principle diagonal.
Our model is said to be sensitive if the values in the principle diagonal is high and off diagonal elements (i.e values that are not present in principle diagonal) is small.
Some more important terms to know:
-
True Positive Rates (TPR) = \({TP\ (\ True\ Positive) \over P\ (Total\ Number\ of\ Positive\ class\ )}\)
-
True Negative Rate (TNR) = \({TN\ (\ True\ Negative) \over N\ (Total\ Number\ of\ Negative\ class\ )}\)
-
False Positive Rate (FPR) = \({FP\ (\ False\ Positive) \over N\ (Total\ Number\ of\ Negative\ class\ )}\)
-
False Negative Rate (TNR) = \({FN\ (\ False\ Negative) \over P\ (Total\ Number\ of\ Positive\ class\ )}\)
Congratulate yourself as you have good knowledge about confusion matrix ,if you have read till here. Now lets know a bit more about this performance metric( confusion matrix).
As we have seen in my previous blog about Accuracy , in case of imbalanced data ,and when we have a dumb model, accuracy will yield misleading results. If you do not remember this case, I request you to please refer my blog on Accuracy.
What do you think, how confusion matrix works with imbalanced data.
A dataset is said to be imbalanced when the numbers of observations in different classes vary greatly.
Lets understand with an example . . .
Consider a case where we have 100 images . Out of which 95 are cats and 5 are dogs. Consider our model to be dumb and irrespective of the image we provide as input ,out model will return it as cat. So when we take accuracy,
\(\ Accuracy\ =\ {95 \over 100} = 95\%\). Which is considered to be ausome. But we know that glitch.
Lets see the confusion matrix ,
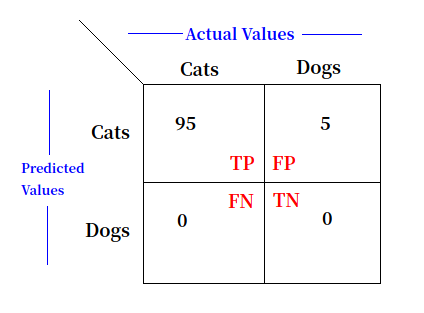
From the above image lets suppose Cats class as Positive class and Dogs class as Negative class. You can take what ever way you want. From the above confusion matrix we can visualise the performance of our model.
\[\ TPR\ = {TP \over Total\ Positive\ classes} = {95 \over (95+0)}\ = 1\ or\ 100\%\] \[\ TNR\ = {\ TN \over Total\ Number\ of\ Negative\ class\ } = {0 \over (5+0)}\ = 0\ or\ 0\%\]Total positive classes = TP + FN
Total Number of Negative classes = FP + TN
Similarly finding
\[\ FPR = {5 \over 5} =\ 1\ or\ 100\%\] \[\ FNR = {0 \over 95} =\ 0 \ or\ 100\%\]By looking at TPR, TNR, FPR, FNR we can say that the model doesn’t seem to work properly. Generally a model is said to be good if TPR, TNR is high compared to FPR and FNR is low.
Hence we can justify that confusion matrix does not mislead us with unbalanced data, unlike accuracy.
We might have a question accuracy is just one number , so we can easily compare the performance whereas in confusion matrix we have 4 values(TPR, TNR, FPR, FNR), which value should be given more priority and less priority, it’s confusing right …
Practically speaking this changes from one domain to another. Consider an example where we need to diagnoise cancer. Lets consider having cancer as Positive and not having cancer as negative. False Positive Rate means what is the ratio of a person who don’t have cancer but still diagnoised as a cancer patient to the total number of non cancerous patients. When we look in this domain have high FPR does mean our model is performing bad. In such case the patient will be further diagnose with better technology or scans. Where as having a high False Negative Rate is a sign of danger.
In any case TPR and TNR should be high enough.
So confusion matrix have resolver one problem that we faced with accuracy, i.e handling unbalanced data. But still like accuracy, confusion matrix aslo takes predicted values and cannot handle probabilty scores, which can lead to problem ,that I have explained in my accuracy blog.
Well done! Thank you for reading till here , and I hope this blog gives you a clear insight about confusion matrix.
References :
Let me know what you think of this article on twitter @GottipatiG!